The product

One binary.
Every signal, explained.

Panopticon is a single self-hosted application that sits between your metrics store and the people who need to understand it — customers, on-call engineers and leadership alike. Nothing here is machine-learning guesswork: every signal is typed, every detector is deterministic Go code, and every explanation can be read, not just believed.

Configuration, not code

A signal is a typed document, not a dashboard you build by hand.

An administrator defines what a metric means once: its unit, how values should be combined — a sum, a ratio, a weighted mean, a rate, a delta — which labels customers may filter by, and how it should be charted. Every draft is validated against a schema before it can go anywhere near a customer.

Chart types that fit the data

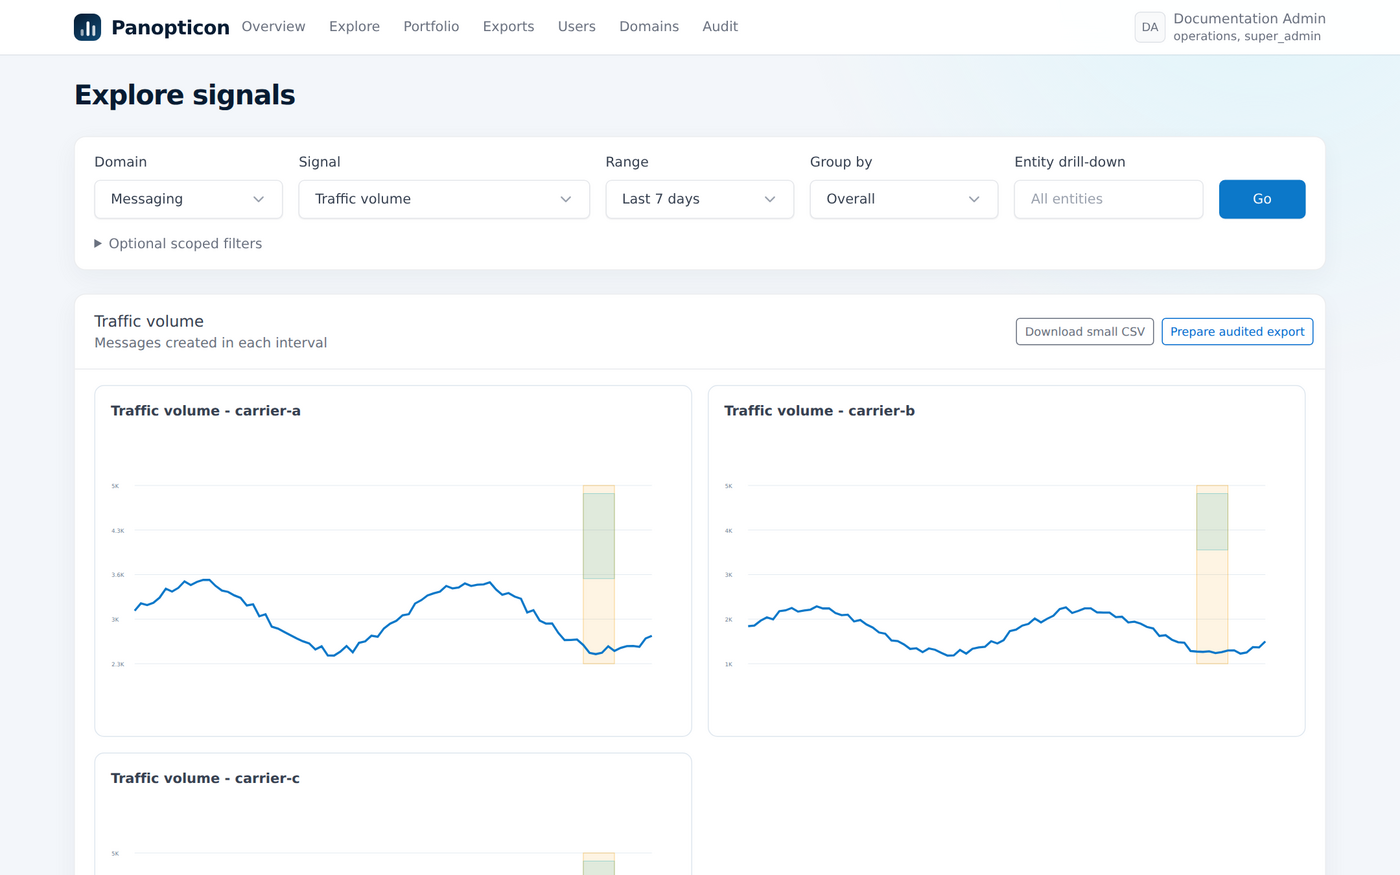
Line, bar, 100% stacked bar or a plain table. A legend label can name each series by a chosen field, or split into a separate titled graph per value — "Traffic volume – carrier A", "Traffic volume – carrier B" — without writing a new page.

Filters the server actually enforces

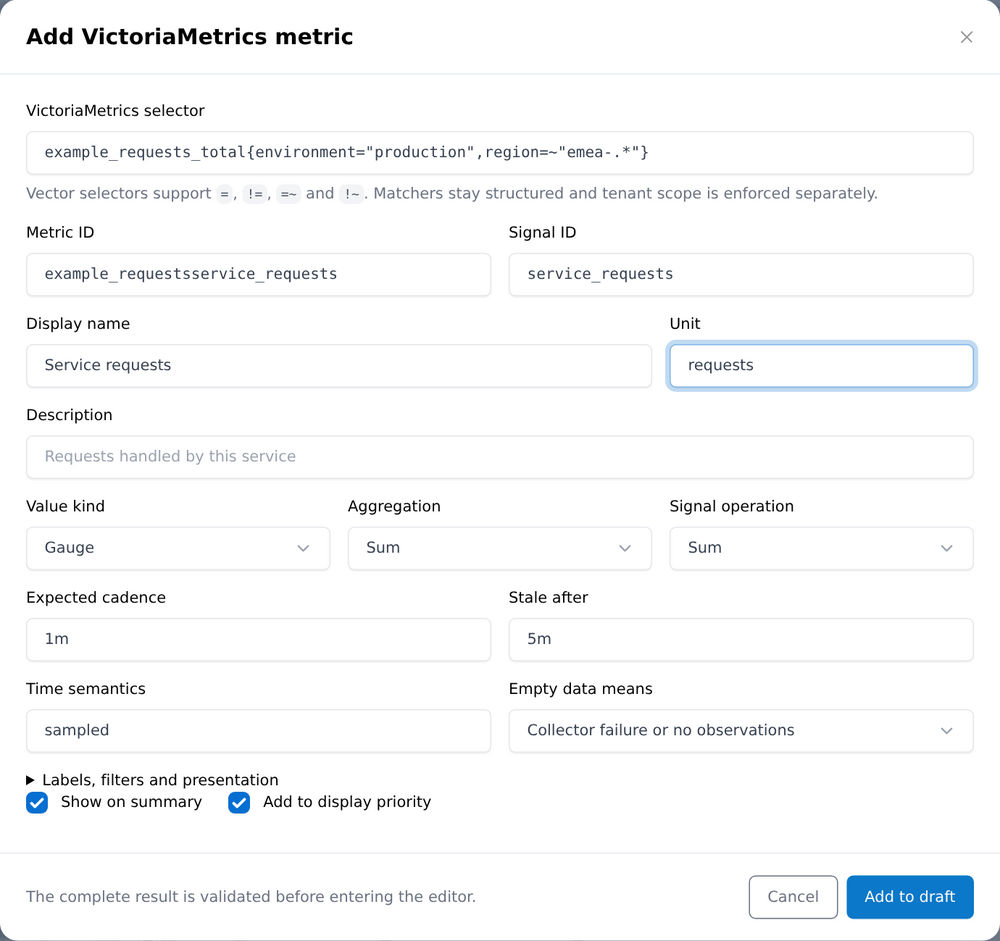
Selector matchers accept the full VictoriaMetrics vector-matcher grammar — =, !=, =~, !~ — stored as structured, validated data. Whatever an administrator writes, a customer's request is still intersected with their own scope before it reaches the metrics store.

Explore signals screen showing a custom date range and one titled graph per legend value
A signal configured to render one graph per legend value, each titled automatically — one of several presentation options an administrator chooses without writing a line of code.

Thirteen detector families

Detectors, in plain English.

Every family runs independently against every signal it's attached to. Pick the one that matches how that signal actually misbehaves — not a single generic "anomaly" toggle.

Sudden changes

  • Rate of change — a sudden jump or drop, faster than normal wobble.
  • Threshold — crossing a fixed, known limit.

Slow drift

  • Rolling baseline — departure from the recent normal level.
  • Sustained degradation — a problem that persists rather than blips.
  • Regression baseline — deviation from a modelled reference relationship.

Weird shapes

  • Volatility burst — unusually erratic values.
  • Flapping — rapid oscillation between states.
  • Seasonal — a break in the expected daily or weekly pattern.

Going quiet

  • Missing data — samples that should be arriving and aren't.
  • Stuck metric — a value that has stopped changing at all.

Comparisons

  • Cross-series outlier — one entity behaving unlike its peers.
  • Lag comparison — divergence from a reference signal, with an expected delay.
  • Binomial regression baseline — a statistically unlikely success rate.

Every detector carries its own noise controls — minimum duration, minimum evidence volume, and a minimum confidence threshold — so a sparse or borderline signal is marked informational rather than hidden, or ignored outright below a threshold you choose.

Evidence, not a verdict

Open a finding and see exactly why.

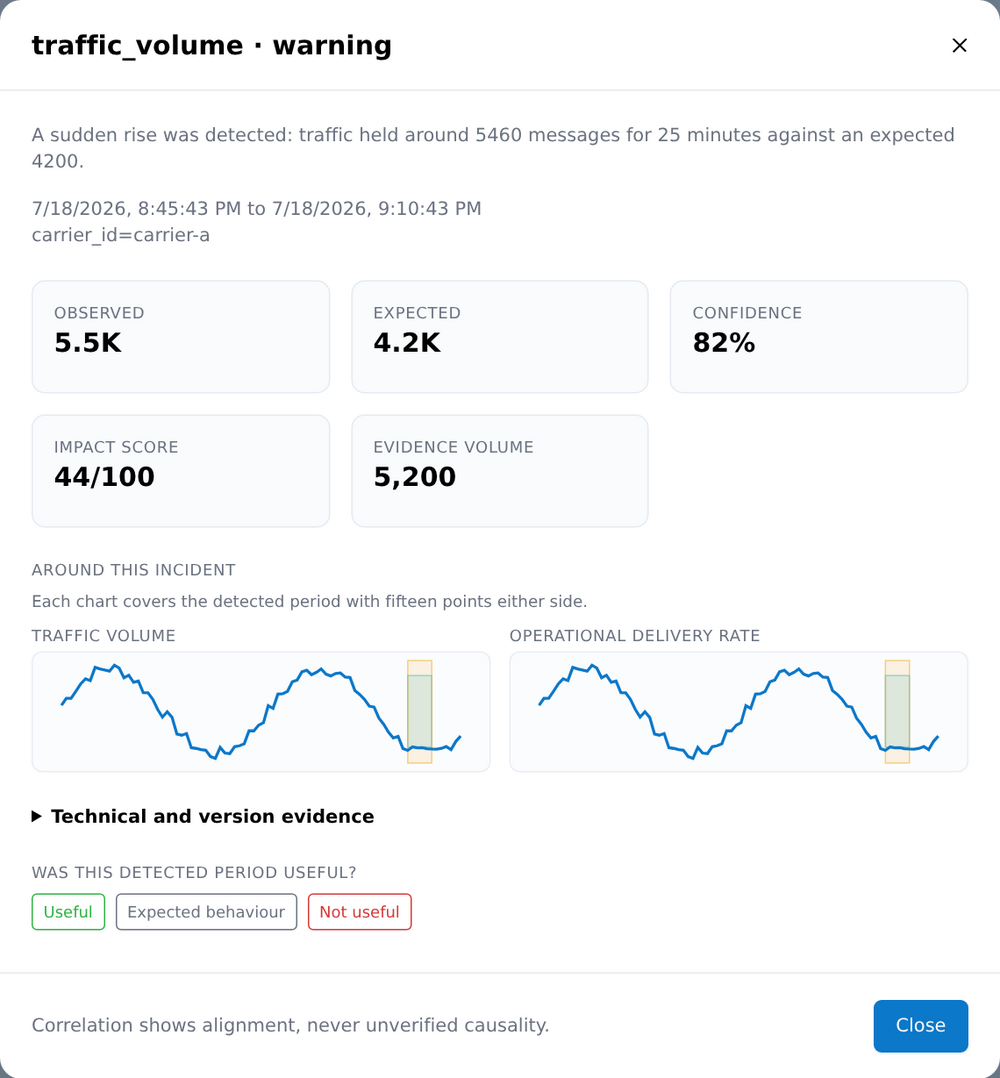
Every detected period carries an observed value, an expected range, samples, a confidence score, an affected share and a plain-English sentence — plus the exact domain and detector version that produced it, so the same evidence still makes sense a year later.

Correlation, honestly

Findings that align — never findings that "cause".

An administrator can declare that two signals corroborate each other: an expected direction, a time tolerance, matching labels. When findings on both signals line up, Panopticon shows them together as one detected period. It will tell you a traffic spike and a latency rise happened at the same time for the same carrier — it will never claim one caused the other.

Green — healthy, current evidence Amber — a change needs attention Red — a material issue is active Grey — not enough evidence to judge

Grey matters as much as red. A signal with stale or insufficient data is marked unknown rather than quietly shown as fine — and a low-volume finding can't become a critical alert on its own.
The workbench

Draft, validate, backtest, publish — reversibly.

Every change to what's monitored goes through the same reviewable pipeline. Nothing reaches a customer until someone deliberately publishes it, and every published version stays immutable for as long as the audit trail needs it.

Draft

Edit with guided wizards or typed YAML. Nothing live changes yet.

Validate

A full schema and consistency check before a draft can be saved.

Backtest

Run new detectors against real recent history, without publishing.

Publish

An immutable, versioned release — the previous version retires cleanly.

Enable

A separate, deliberate step turns a domain on for customers.

Want to see your own metrics in this shape?

We'll walk through what you're monitoring today and show you what the evidence would look like.